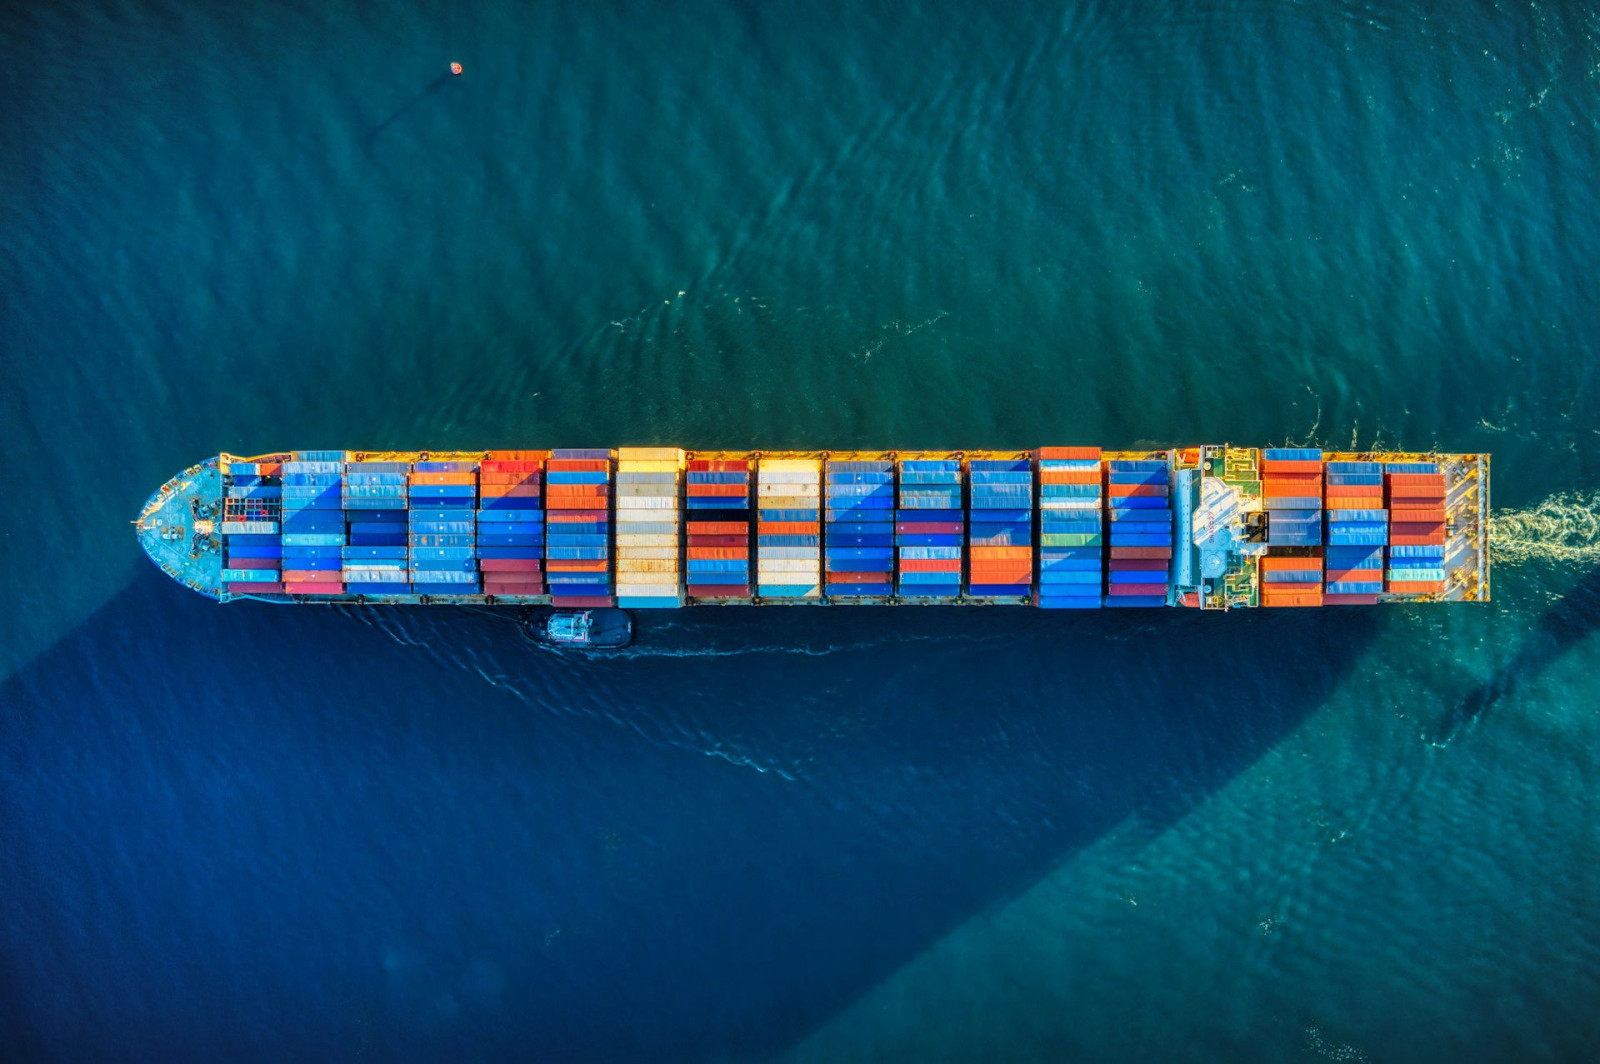
Volume was 3% higher than a year earlier and 22% above August 2019, the last comparable pre-pandemic period.
That gap is significant. At 2.6 million TEUs, a 22% increase implies August 2019 volume of roughly 2.13 million TEUs — meaning U.S. ports are now processing about 470,000 more containers per month than at the same point before the pandemic.
2.6 million TEUs changes the comparison
The latest number is not simply a rebound from a weak base. Imports are running well above both last year and pre-COVID levels:
- August 2026: 2.60 million TEUs
- Year-over-year: +3%
- vs.August 2019: +22%
- Historical rank: No. 3
A 3% annual increase translates into roughly 76,000 additional TEUs compared with August last year.
The Port of Los Angeles alone processed 955,907 TEUs in August, while June-August throughput reached a record 2.9 million TEUs. That puts the three-month average at roughly 967,000 TEUs per month.
Retailers pulling holiday inventory forward contributed to the volume. Earlier arrivals reduce exposure to new tariffs and give importers more time to deal with possible shipping disruptions later in the year.
Freight prices tell a different story
High volumes have not brought shipping costs back to normal. Rates from Shanghai to New York have more than doubled year-over-year, according to the supplied data. A shipment on the route therefore costs at least twice as much as it did a year ago, before tariffs, port charges and inland transportation are included.
The pressure comes from several directions. Red Sea disruptions have forced carriers to alter routes, while risks around the Strait of Hormuz have added another layer of uncertainty to global shipping.
Longer routes mean more vessel days, more fuel consumption and fewer effective ships available for each trade lane. Even without a comparable increase in cargo demand, that loss of effective capacity can push spot freight rates higher.
More cargo, higher landed costs
The contrast is increasingly sharp: imports are near record highs while transportation costs are rising rather than falling.
August provides the numbers:
- 2.6 million TEUs entered U.S. ports.
- Volumes were 3% higher year-over-year.
- They were 22% above 2019.
- Shanghai-New York freight rates were more than 100% higher than a year ago.
For importers, the combination matters more than either number alone. A company can maintain shipment volumes and still face substantially higher costs per container once freight rates and tariffs are included.
That pressure can move through the supply chain in three ways: lower importer margins, lower prices negotiated with suppliers, or higher prices charged to U.S. customers.
The August data therefore show two very different records of the same trade environment: container demand is close to an all-time high, while the cost of getting those containers into the U.S. is moving sharply higher.